Chain BI and Store BI
The whole chain, ranked and compared
Chain BI is the whole-chain view; Store BI is one store, including how it compares with the others.
- Chain at a glance shows Gross, Tickets, Average ticket, Tips, Service share and Momentum, with change against the compared period
- The Store leaderboard ranks every store by gross, with a trend line for periods up to 62 days
- Flags names the stores worth a look, such as Sales down, No sales, Overbooked or Below goal, with the figure that put them there
- Goals shows net sales against your company goal and the stores below it
- Each store's day is cut at that store's own day, not the device's
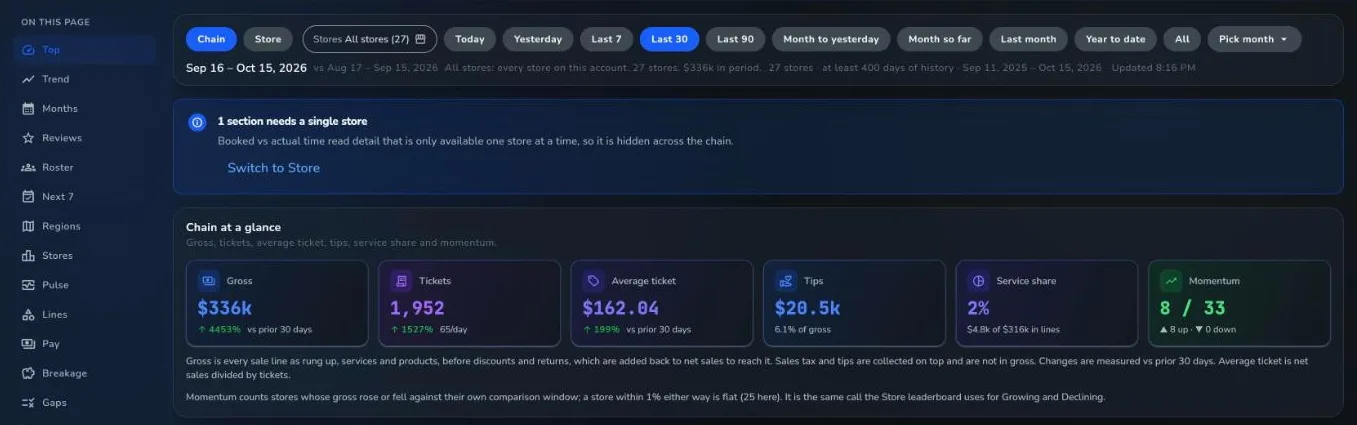
A real Franpos screen, from a demo store with sample data.