Reports and analytics

Answers before you finish asking.

Most businesses have a number they check every morning and a question they never get to ask. Franpos puts the figures you live by on one Dashboard, a full report library behind it, and the same numbers in both. Pick the dates and the store. The answer is there, to the last cent.

A Dashboard that matches your reportsExport to Excel or PDFEmail any report on a schedule
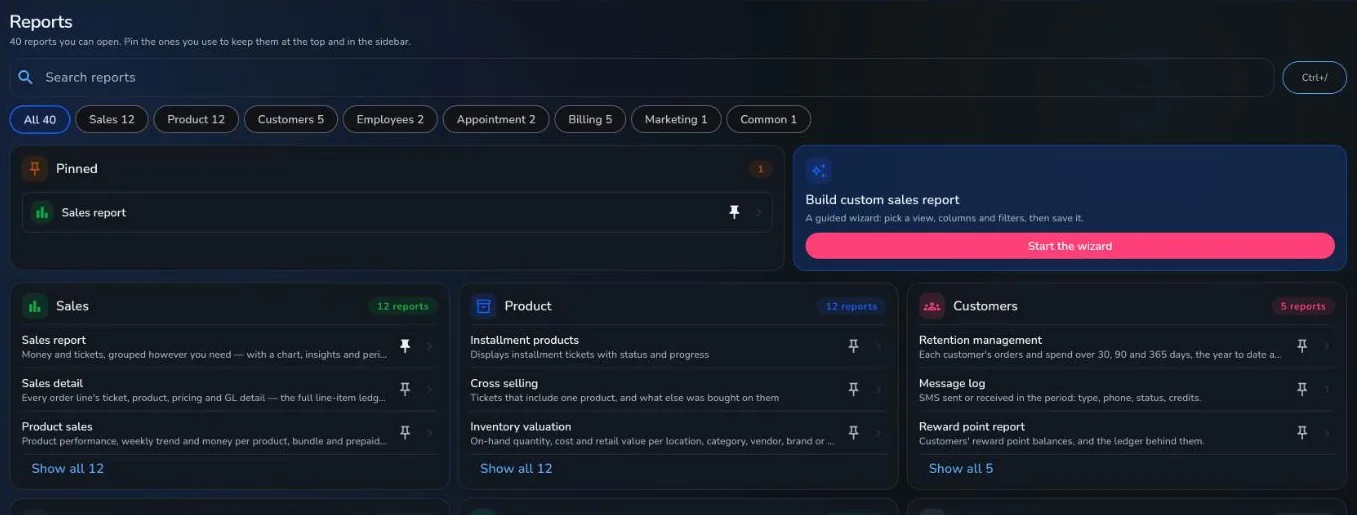
The Reports page: reports grouped by Sales, Product, Customers, Employees, Appointment and Billing

Your day on one page

The Dashboard is the home screen for your numbers: one page of cards, in the order you want them.

Dashboard

The figures that run the business, matching your reports

The cards read the same figures the reports use, so a number on the Dashboard matches the matching report.

  • Net sales, Transactions, Average ticket, Tips, Labor cost and Goal attainment, with Today shown so far as it grows through the day
  • Net sales is after discounts and before tax, with returns taken off; gift cards, deposits and memberships have their own cards
  • Pick a store or a group of stores, and a preset such as Today, Last month or Year to date, or your own dates
  • Customize lets you rearrange, add or remove cards, and the arrangement is saved to your account
  • People without company access see My day: their own shift, hours and tips
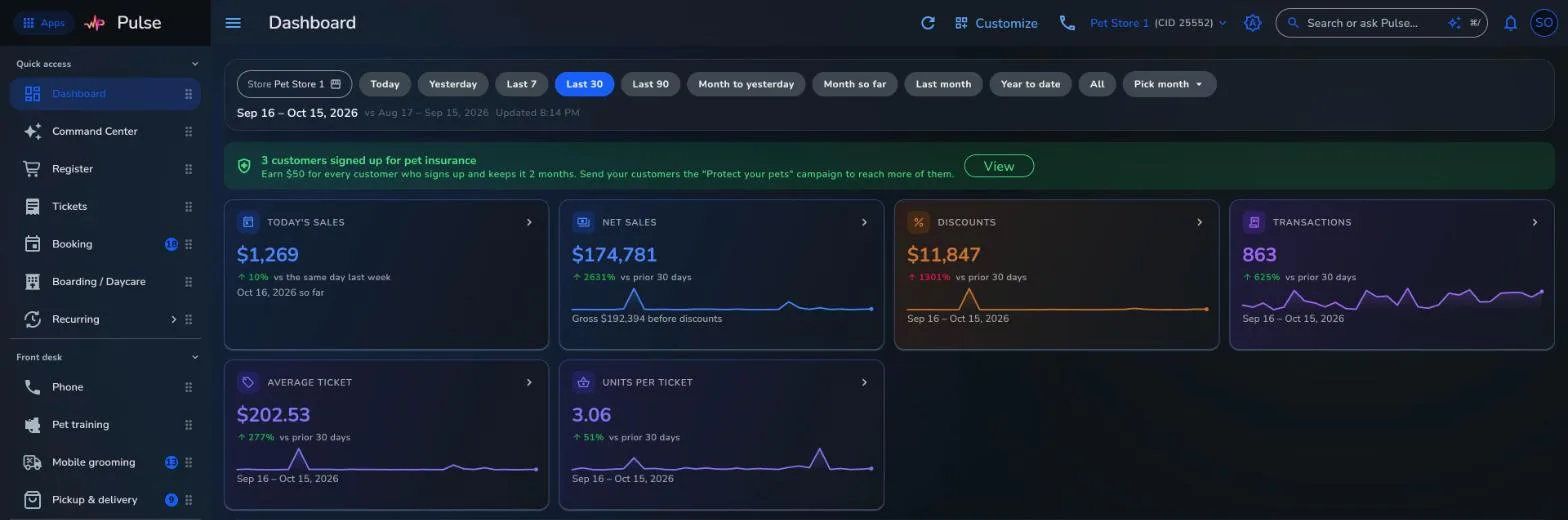
The Franpos Dashboard: today's sales, net sales, discounts, transactions and average ticket, with a sales trend chart

A real Franpos screen, from a demo store with sample data.
A report library that answers back

Reports are grouped by area, and you can search them from the top.

Reports

Find it. Filter it. Take it with you.

Open Reports, search, and run what you need.

  • Search the report library, and Pin to sidebar the ones you use most
  • Choose the dates, the location, and where offered, All locations; tap a row to drill into the detail behind it
  • Export to Excel or PDF, following the columns and filters on screen
  • Email report sends it daily, weekly or monthly to the addresses you list
  • The Build custom sales report wizard asks for a type, a grouping, your columns, filters and dates, then saves your view
The Reports page: reports grouped by Sales, Product, Customers, Employees, Appointment and Billing

A real Franpos screen, from a demo store with sample data.

The questions behind the numbers

Who buys, what sells, who owes whom

Reports that go past the totals.

  • Customer visit mix: who buys products, services or both, and how often each group comes back
  • Product mix for food: Stars, Plowhorses, Puzzles and Dogs on your menu
  • Stock transfer settlement: who owes whom between your stores
  • The shift report, or Z report, shows one person's shift with sales, tips and totals, and you design which lines print

Many stores? See them all.

For businesses with more than one location, the BI group goes further.

Chain BI and Store BI

Revenue, mix and flags, store by store

Long, scrollable reports built for businesses with many locations.

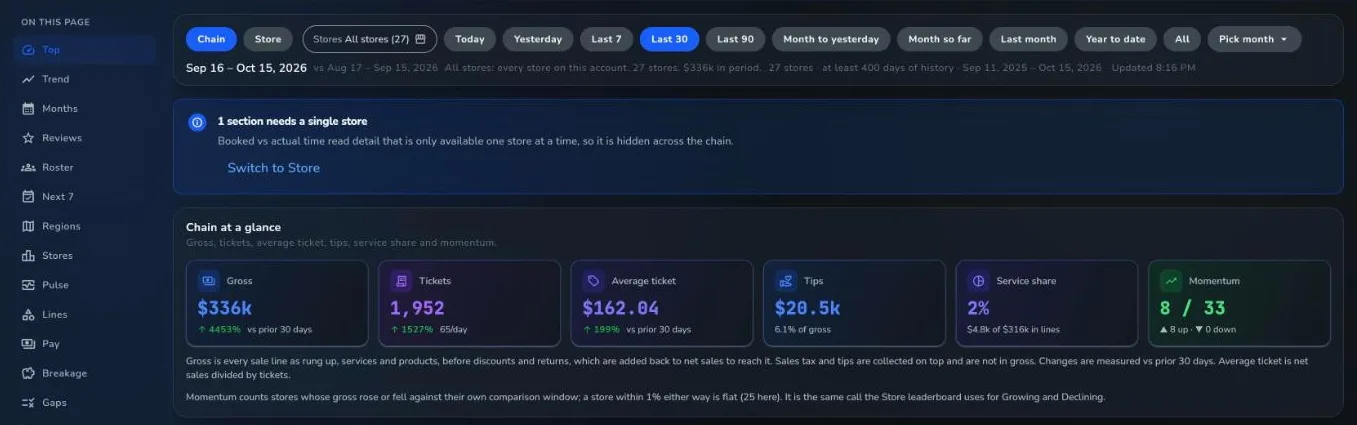
  • Chain BI shows revenue day by day, sales by weekday and by channel, how customers pay, people and hours clocked, flags and goals
  • Store BI shows one store's daily sales, sales by hour, how it compares, hours on the floor and team productivity
  • A Quality section tells you how far to trust the figures on the page, with Problems, Worth knowing, Clean or Not checked
Chain BI: gross, tickets, average ticket, tips, service share and momentum across stores

A real Franpos screen, from a demo store with sample data.

04 · Trust the number

Built so a figure means the same thing everywhere

How Franpos keeps its numbers honest.

One set of figures

The Dashboard cards read the same figures the reports use.

Your store's own clock

Every day, week and month follows your store's own clock.

Access by permission

Which reports you see depends on your Access permission and your kind of business.

Saved views that roll

A view saved as Last 7 days always reopens on the last 7 days.

Reports and analytics, answered

What reports does Franpos have?
Reports are grouped by area, such as Sales, Product, Customers, Employees, Appointment and Billing, with a search box. Businesses with many locations also get Chain BI and Store BI.
Can I export reports to Excel?
Yes. Export gives you the report as you see it, with your filters and columns, to Excel, and to PDF on reports that support it.
Can reports be emailed to me automatically?
Yes. Open a report that can be scheduled, tap Email report and choose daily, weekly or monthly, a time and the email addresses.
Do the Dashboard and the reports agree?
Yes. The Dashboard cards read the same figures the reports use, so a number on the Dashboard matches the matching report.
Can I build my own report?
Yes. The Build custom sales report wizard walks through a type, a grouping, your columns, filters and a date range, and saves the view.
What does it cost?
Every business is different, so we quote per location. Book a demo and we will walk you through it.

Ask your business anything.

Book a demo and ask the question you never had time for.

Trusted by thousands of businesses, including

Woof Gang BakeryTraegerRunzaMenchie'sEarthWise PetMud BayPet PlanetDog KrazyPro Image SportsPet WantsBest West Pet FoodsBrothers Country SupplySam's Cats & DogsMagoo's Pet OutletWoof MeowDogPerfectPACGatewayShubhSumUpWoof Gang BakeryTraegerRunzaMenchie'sEarthWise PetMud BayPet PlanetDog KrazyPro Image SportsPet WantsBest West Pet FoodsBrothers Country SupplySam's Cats & DogsMagoo's Pet OutletWoof MeowDogPerfectPACGatewayShubhSumUp